
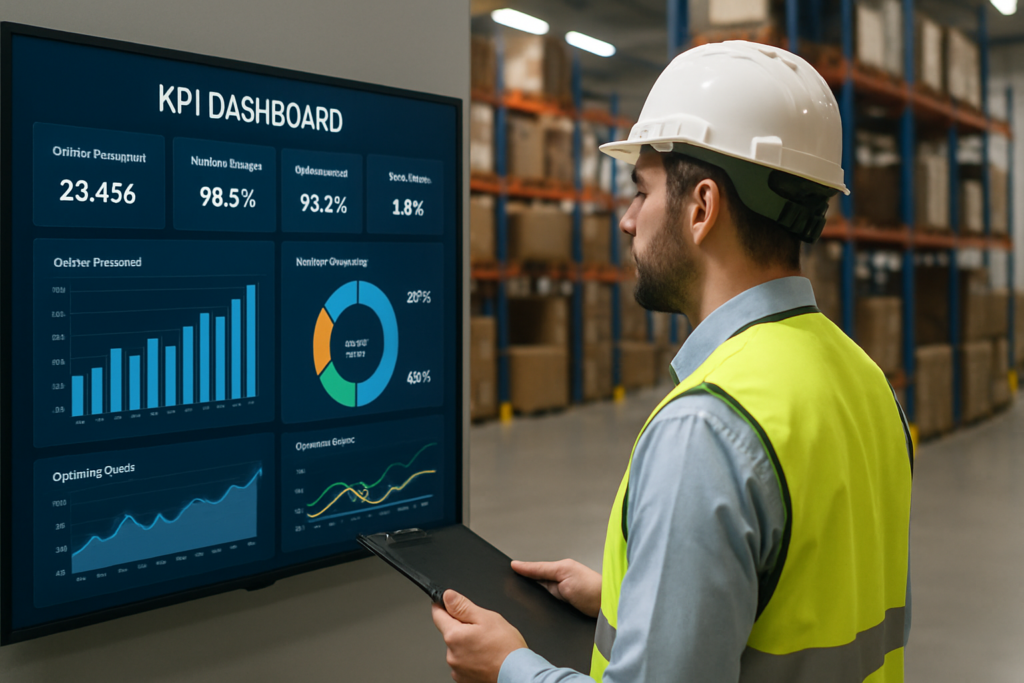
Warehouse KPIs to track are the specific, measurable metrics that tell you whether your operations are running efficiently or quietly losing money. Moreover, monitoring the right ones consistently gives you the visibility to fix problems before they compound into costly errors or missed deliveries.
The global warehouse market was valued at approximately $1.2 trillion in 2025. Additionally, it is expected to reach nearly $2 trillion by 2033, according to Omniful. At that scale, even marginal inefficiencies translate into significant dollar losses. Therefore, knowing which numbers to watch and what they reveal is foundational to running a competitive operation.
Table of Contents
- The Core Metrics That Define Warehouse Health
- Labor and Cost KPIs Worth Watching Closely
- Inventory and Accuracy KPIs to Track
- Fulfillment and Throughput Performance KPIs to Track
- Things to Know
- Track Your KPIs With a Smarter Warehousing Partner
- Frequently Asked Questions
The Core Metrics That Define Warehouse Health
Not every number on your dashboard carries equal weight. The most impactful warehouse KPIs to track fall into four categories: order accuracy, labor productivity, inventory performance, and fulfillment speed. Together, they paint a complete operational picture.
Before diving into individual metrics, it helps to understand the difference between a storage-focused facility and one built around fulfillment. In fact, reviewing the fulfillment center vs warehouse breakdown provides useful context to guide which KPIs should carry more weight in your specific environment.
Order Accuracy Rate measures the percentage of orders shipped without errors. Average warehouse operations achieve 85 to 90% order accuracy. However, best-in-class operations reach 97 to 98% and top performers exceed 99.5%, according to NetSuite (2025). Even a small gap between your current rate and that upper threshold creates real costs through returns processing, customer service time, and reputation damage.
On-Time Shipping Rate tracks how frequently orders leave the facility within the promised window. This metric connects directly to customer satisfaction. Moreover, it is especially sensitive in eCommerce environments where next-day or two-day expectations are standard.
Receiving Accuracy and Cycle Time reflect how efficiently inbound freight is processed and stocked. Slow or inaccurate receiving delays the entire downstream process. In addition, facility teams that track this separately from outbound metrics are better positioned to isolate bottlenecks at the dock versus the pick aisle.

Labor and Cost KPIs Worth Watching Closely
Labor is the single largest expense in most warehouse operations. According to Camcode (2026), labor typically accounts for 45 to 57% of warehouse operating expenses. Furthermore, over three-quarters of supply chain organizations face notable workforce shortages. Therefore, managing this well requires specific metrics, not guesswork.
Labor Cost Per Unit divides total labor spend by the number of units processed in a given period. Tracking this over time reveals whether efficiency is improving or eroding as volume fluctuates. Additionally, it helps justify investments in automation or layout redesign.
Pick-and-pack costs averaged $3.18 per B2C order and $4.79 per B2B order in 2024, per Hopstack. If your per-order cost sits above these benchmarks, your pick path design, staffing model, or technology stack likely needs review. Picking operations alone account for 55% of warehouse labor costs. In addition, advanced tools like barcode scanners can achieve 99.9% picking accuracy while reducing order processing times by 15 to 25%, according to Camcode (2026).
Units Picked Per Hour is a direct productivity indicator for warehouse associates. It varies by facility type, product size, and technology in use. However, trending this metric weekly allows supervisors to identify underperformance early and adjust training or workflow.
Transportation-adjacent costs are also worth factoring into your cost per order calculations. For example, understanding truck driver hours of service rules is relevant because carrier delays driven by compliance requirements can inflate last-mile delivery costs and distort your outbound shipping KPIs.
Inventory and Accuracy KPIs to Track
Inventory-related KPIs are among the most consequential because errors here ripple through every other part of the operation.
Inventory Accuracy Rate compares what your system says you have against what is physically in the facility. World-class operations maintain inventory accuracy at 97% or higher, according to NetSuite (2025). Below 95%, stockouts and overstock become routine problems that cost you sales and tie up working capital.
Inventory Turnover measures how many times your total stock cycles through in a year. High turnover generally signals strong demand alignment. In contrast, low turnover points to overbuying or slow-moving SKUs consuming valuable space. This KPI is especially critical for businesses comparing amazon fba vs 3pl fulfillment, since storage fee structures differ significantly between models.
Shrinkage Rate captures loss from damage, theft, or administrative error. It is easy to overlook until a physical count reveals a large discrepancy. Therefore, tracking it proactively and segmenting by cause helps teams address the specific root issue rather than applying broad, ineffective fixes.
Robust warehouse inventory management software provides the infrastructure that makes these metrics visible in real time. Without system-level tracking, accuracy data is only available at scheduled counts, which is too infrequent for dynamic operations.

Fulfillment and Throughput Performance KPIs to Track
Throughput KPIs measure the volume your facility can process within a set timeframe. These metrics matter most when order volumes spike during peak seasons or promotional events.
Order Cycle Time is the elapsed time from when an order is placed to when it ships. Shorter cycle times provide a competitive advantage. Moreover, this matters particularly for DTC and eCommerce brands competing on delivery speed.
Dock-to-Stock Time reflects how quickly received inventory becomes available for picking. A long dock-to-stock cycle means items sit in a receiving area instead of generating revenue. Additionally, it skews available inventory counts.
Return Processing Rate tracks how efficiently the reverse logistics workflow handles incoming returns. In eCommerce-heavy operations, returns volume can represent a substantial percentage of total order volume. However, slow return processing delays restocking and inflates days-on-hand figures.
According to WERC’s 2026 DC Measures study, 48.6% of distribution professionals identified cost reduction as their top priority. Tracking throughput KPIs directly supports that goal by surfacing where capacity is wasted and where process improvements can deliver the most impact.
Things to Know
- Tracking too many KPIs at once dilutes focus. Most operations benefit most from 8 to 12 tightly defined metrics reviewed on a consistent schedule.
- A KPI is only as useful as the data behind it. Inaccurate inputs, whether from manual counts or disconnected systems, produce misleading outputs.
- Over 90% of warehouses now use some form of AI or advanced automation, per Omniful (2025). This makes technology investment a near-universal baseline rather than a differentiator.
- KPI benchmarks vary by industry vertical, facility size, and fulfillment model. Therefore, comparing your numbers against general averages without accounting for those variables can lead to misplaced priorities.
- Leading indicators like dock-to-stock time are more actionable than lagging indicators like annual shrinkage. Balance your dashboard across both types for the clearest operational picture.
Track Your KPIs With a Smarter Warehousing Partner
At Warehousing NYC By Best, we work with businesses across the NYC metro and tri-state area that need more than storage space. They need visibility, accountability, and a 3PL partner that takes performance metrics seriously.
Our cloud-based WMS gives clients real-time inventory tracking, cycle count reporting, and fulfillment data that feeds directly into the KPIs that matter most to their business. If your current operation is running blind or your numbers are trending in the wrong direction, we can help you identify the gaps and address them with practical solutions.
Request a free estimate today and find out how our fulfillment infrastructure can improve the metrics your business depends on. Reach out now and our team will respond with a tailored assessment of how we can support your warehousing goals.
Frequently Asked Questions
Q: How many warehouse KPIs should a business track at once?
Most operations perform best when they focus on 8 to 12 clearly defined KPIs reviewed on a regular cadence. Tracking too few metrics leaves blind spots. However, tracking too many creates noise that makes it harder to act on findings. Start with the highest-impact categories (accuracy, labor cost, inventory, and throughput) and add metrics as your reporting infrastructure matures.
Q: What is considered a good order accuracy rate for a warehouse?
A rate of 97 to 98% is considered best-in-class. In addition, top-performing operations exceed 99.5%, according to NetSuite (2025). If your facility is currently operating below 95%, the priority should be identifying whether errors originate in picking, packing, or labeling, as the root cause determines the appropriate fix.
Q: How often should warehouse KPIs be reviewed?
High-frequency operational KPIs like units picked per hour or dock-to-stock time should be reviewed daily or weekly. However, financial KPIs like cost per order can be reviewed monthly. The cadence should match the speed at which you can act on the data. For example, reviewing throughput metrics monthly means problems compound for weeks before anyone intervenes.
Q: What technology is needed to track warehouse KPIs effectively?
A warehouse management system (WMS) integrated with your order management and ERP platforms is the baseline requirement for reliable, real-time KPI tracking. Without system integration, data must be compiled manually, which introduces lag and error. Barcode scanning, cycle count automation, and carrier integrations further improve data quality across all metric categories.
Q: Why does inventory accuracy drop below the 97% benchmark in many facilities?
The most common causes are infrequent cycle counts, manual receiving errors, and systems that do not update inventory in real time. Facilities that rely on annual physical counts rather than rolling cycle count programs tend to discover discrepancies far later. As a result, the gap has already affected fill rates, customer orders, or financial reporting.